
Session Intelligence
AgentsView 0.23.0 adds a session-intelligence layer on top of the raw transcript archive. Instead of only showing message history, AgentsView now computes per-session health signals, outcome classifications, and aggregate health analytics so you can quickly spot sessions that went well, sessions that stalled out, and patterns that keep recurring across projects.
Where It Appears
Session intelligence shows up in four places:
- Session detail UI — the session header now includes a health grade badge. Click it to open the in-session signal panel.
- Analytics dashboard — the dashboard includes a Session Health section with score, outcome, tool-failure, compaction, trend, agent, and project breakdowns.
- Programmatic session surface —
agentsview session getandagentsview session listexpose health and outcome fields, plus filters such as--health-grade,--outcome, and--min-tool-failures. - CLI health view —
agentsview healthshows either a recent session list with grade and outcome columns, or detailed signals for a single session.
Health Score
The health score is a penalty-based score out of 100. AgentsView starts from 100 and subtracts penalties from three categories:
- Outcome
- Tool health
- Context pressure
If the final score exists, it is mapped to a grade:
| Grade | Score |
|---|---|
A | 90-100 |
B | 75-89 |
C | 60-74 |
D | 40-59 |
F | 0-39 |
Some sessions remain unscored. That happens when AgentsView
cannot infer a meaningful result beyond an unknown low-confidence
outcome and there is no additional tool-health or context data to
work from.
Penalty Model
The 0.23.0 score model uses these penalties:
| Signal | Penalty |
|---|---|
errored outcome | 30 |
abandoned outcome | 15 |
| tool failure signal | 3 each, capped at 30 |
| tool retry | 5 each, capped at 25 |
| edit churn | 4 each, capped at 20 |
| consecutive failure streak of 3+ | 10 |
| extra compactions after the first | 5 each, capped at 15 |
| mid-task compaction | 8 each, capped at 18 |
context pressure above 0.9 | 10 |
The in-session signal panel shows the exact basis and penalties used for a scored session.
Outcome Classification
Every session is classified into one of four outcomes:
completedabandonederroredunknown
Each classification also carries a confidence level:
highmediumlow
The 0.23.0 classifier uses a few simple rules:
- automated sessions default to
unknown - very short sessions stay
unknown - recently active sessions stay
unknownuntil they have clearly settled - sessions that end on a user turn skew toward
abandoned - sessions with a final failure streak of 3 or more skew toward
errored - sessions that end on an assistant turn skew toward
completed
The analytics dashboard aggregates these into outcome distributions and completion rates by agent and by project.
Tool-Health Signals
Tool-health signals are derived from tool-call history, tool results, and tool-result status events:
- Failure signals — counts calls that look failed, either from
explicit
erroredorcancelledstatus events or from content heuristics such as shell errors andFAILEDwrite/edit results. - Retries — counts repeated identical tool calls when the same tool name and identical input are invoked 3 or more times in a row.
- Edit churn — counts files that were edited or written 3 or more times within a tight ordinal window, which usually signals rework.
- Consecutive failure max — records the longest run of failed tool calls in a session.
These signals feed both the per-session score and the dashboard’s tool-health summary metrics.
Context Signals
AgentsView also tracks context-pressure-related signals:
- Compaction count — how often the session crossed a compact boundary.
- Mid-task compactions — compactions that interrupted active work instead of happening at a clean boundary.
- Context pressure max — the highest context-pressure reading observed for the session when the parser can infer it.
Mid-task compactions are weighted more heavily than ordinary compactions because they are a stronger sign that the agent lost working context and had to recover.
UI Surfaces
Session Header And Signal Panel
When a session has intelligence data, the session header shows a grade badge:
![]()
Clicking it opens the signal panel, which includes:
- grade and numeric score
- outcome icon and confidence
- basis tags showing which categories contributed
- compaction chip with a mid-task indicator when applicable
- penalty chips for the exact deductions applied

If a session does not have enough usable data, the panel renders a small empty-state message instead of a score.
Dashboard Health Section
The analytics dashboard’s Session Health section aggregates the same per-session signals into:
- average health score
- outcome distribution
- tool-failure rate
- compaction summaries
- score trend over time
- by-agent and by-project tables
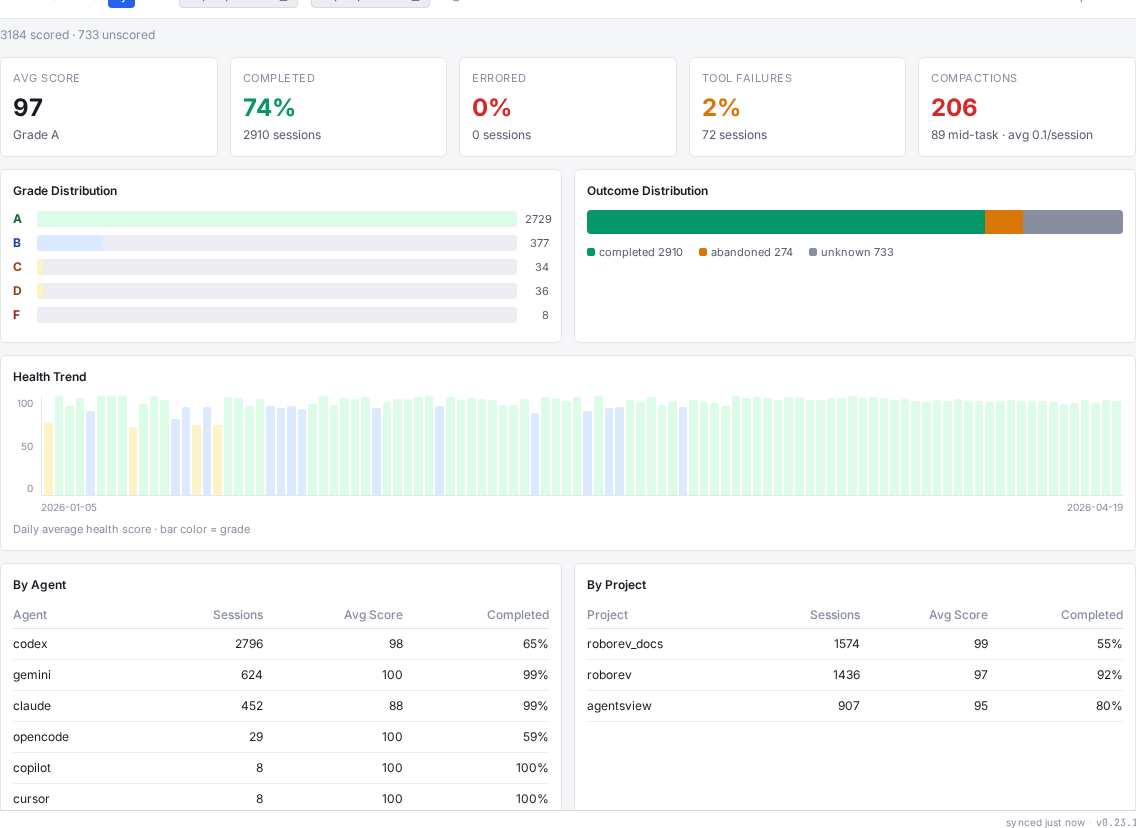
This section is only shown when the current filter window contains scored or unscored signal-bearing sessions.
CLI And API Surfaces
agentsview health
agentsview health is the human-first CLI for quick inspection.
agentsview healthagentsview health --limit 50agentsview health <session-id>agentsview health <session-id> --jsonWithout a session ID it lists recent sessions with grade and outcome columns. With a session ID it prints the detailed signal counts for that session, including tool failures, retries, edit churn, failure streaks, compactions, and context pressure.
agentsview session
Use the Session API docs for the full programmatic surface. The most relevant commands for session intelligence are:
agentsview session get <id> --format jsonagentsview session list --health-grade A,B --outcome completedagentsview session list --min-tool-failures 0session get returns detail-level fields such as
health_score_basis and health_penalties. session list
exposes health and outcome filters for automation-friendly scans.
Relationship To agentsview stats
Session intelligence is per-session and powers the session UI, the session API, and the dashboard health section.
agentsview stats is different: it is an
aggregate reporting command that summarizes windows of session
activity, git activity, tool mix, model mix, and outcome metrics
across the whole workspace.