
Token Usage & Costs
AgentsView’s Claude Code, Codex, OpenCode, and Pi parsers
record the raw token_usage blob on every message they
ingest, so the database already knows every input, output,
cache-creation, and cache-read token those agents have logged.
The agentsview usage commands turn that into daily cost
reports and a one-line today’s-spend summary — without
re-reading any JSONL files.
If you’ve used ccusage
this will feel familiar. AgentsView covers the same core job —
“how much did I spend on AI coding yesterday?” — across Claude
Code, Codex, OpenCode, and Pi, with more agents coming as
their parsers start emitting per-message token usage. Because
it reads from pre-indexed SQLite instead of re-parsing JSONL
on every invocation, it’s also dramatically faster on large
histories (see benchmarks below).
Agent Coverage
Usage Dashboard
AgentsView includes a dedicated Usage page in the web UI,
reachable from the Usage button in the header or directly at
/usage. It’s a focused view of cost and token totals, driven by
the same data the CLI commands read.
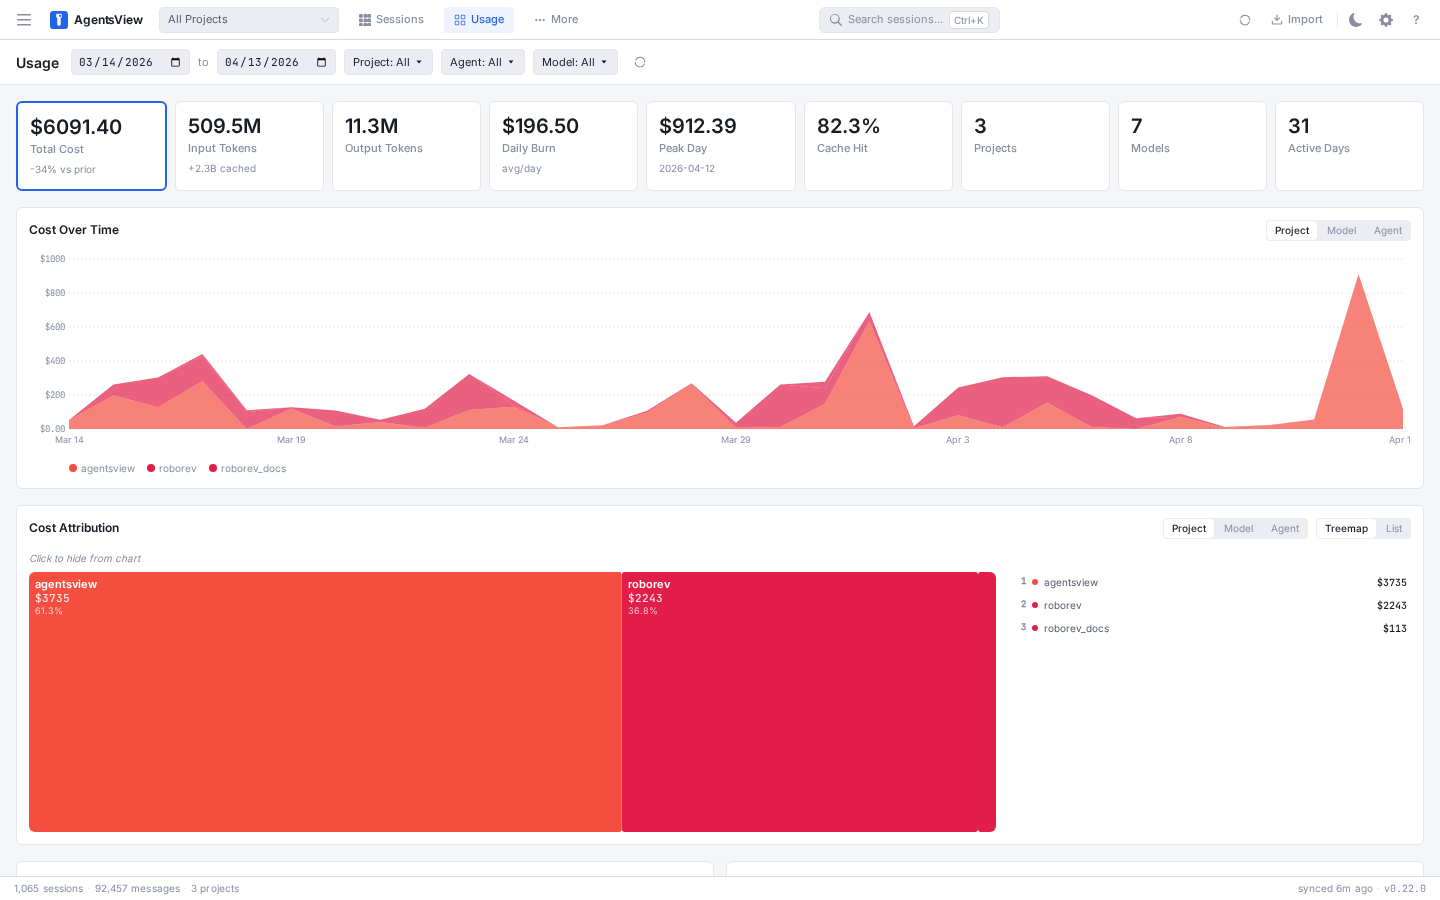
The page is built around four panels: summary cards, a cost trend over time, a cost attribution treemap, and a bottom grid with top sessions by cost and a cache efficiency breakdown.
In 0.23.0, the page also picks up a few workflow improvements:
- the page refreshes automatically on new sync data in normal
agentsview servemode - the
Project | Model | Agentselector is shared between the cost chart and the attribution panel - active filters are preserved when switching between the Sessions and Usage tabs
- the top-cost sessions table now shows session names instead of only IDs or message previews where available
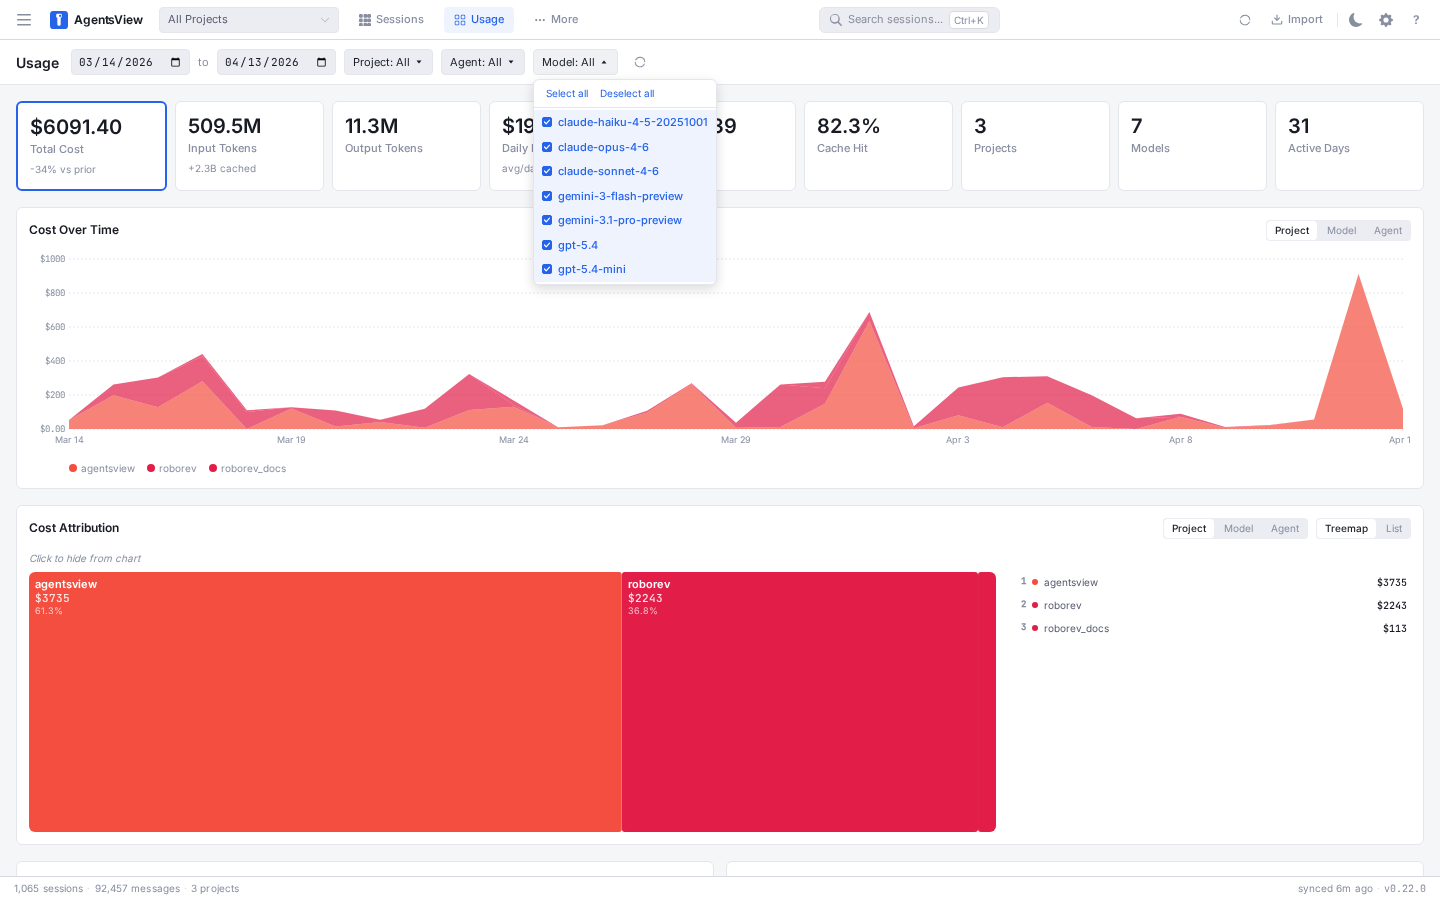
Filters & Date Range
The toolbar at the top of the page scopes the entire dashboard. Pick a start and end date with the date inputs, or narrow down with the Project, Agent, and Model filter dropdowns. Filter state is written back to the URL — copying the address bar gives you a shareable link to the exact view you’re looking at. A Clear filters link appears next to the refresh button when anything is active.

Each filter dropdown supports multi-select with a search box, Select all / Deselect all shortcuts, and a colored dot for agents so you can tell them apart at a glance.
Summary Cards
Eight cards at the top summarize the selected window. The Total Cost card is featured with a larger value; the rest show total tokens, daily burn, peak day, cache hit rate, project and model counts, and active days.

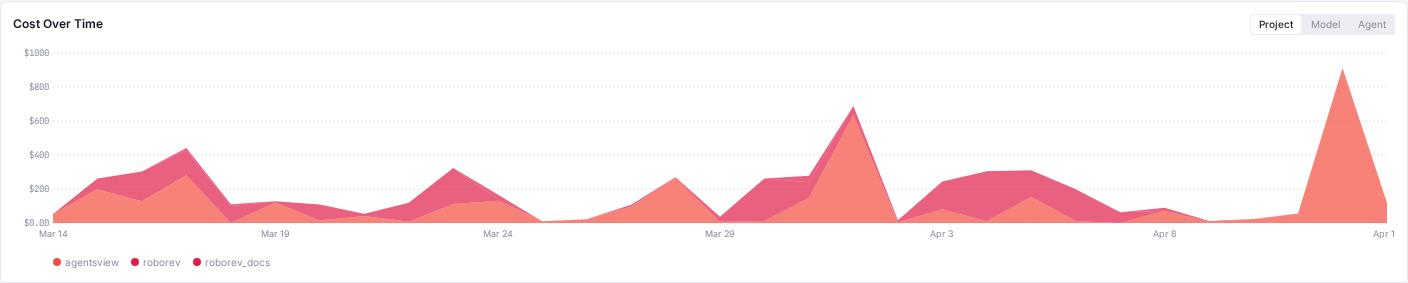
Cost Over Time
A stacked chart shows cost per day across the range, grouped by project, model, or agent — toggle the grouping with the segment buttons in the panel header. Each series is colored consistently with the attribution panel below so you can cross-reference them.
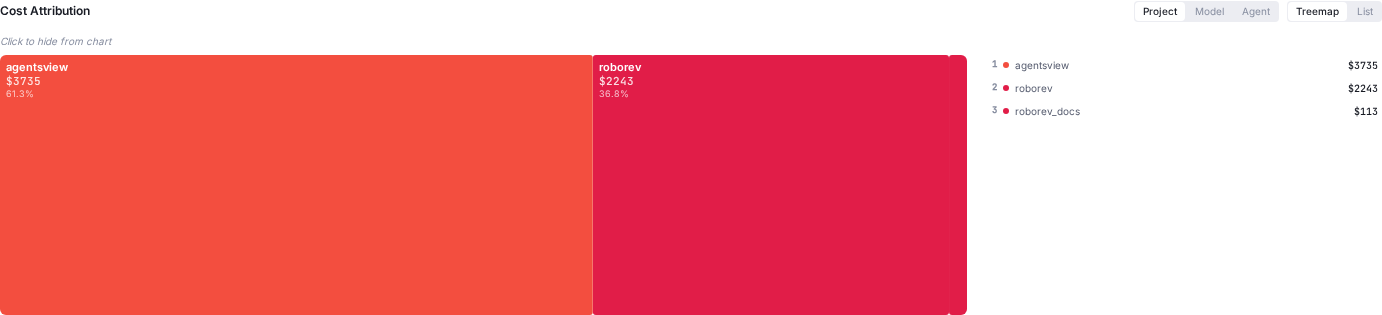
Cost Attribution
The attribution panel breaks down total spend for the window into a treemap plus a ranked side rail. Switch the group-by between Project, Model, and Agent, or flip the view from Treemap to List for a table-style readout. Click any cell (or row) to hide it from the chart above, which is the primary drill-down mechanic — hide the obvious outliers and the remaining breakdown tells you where the smaller spend is going.
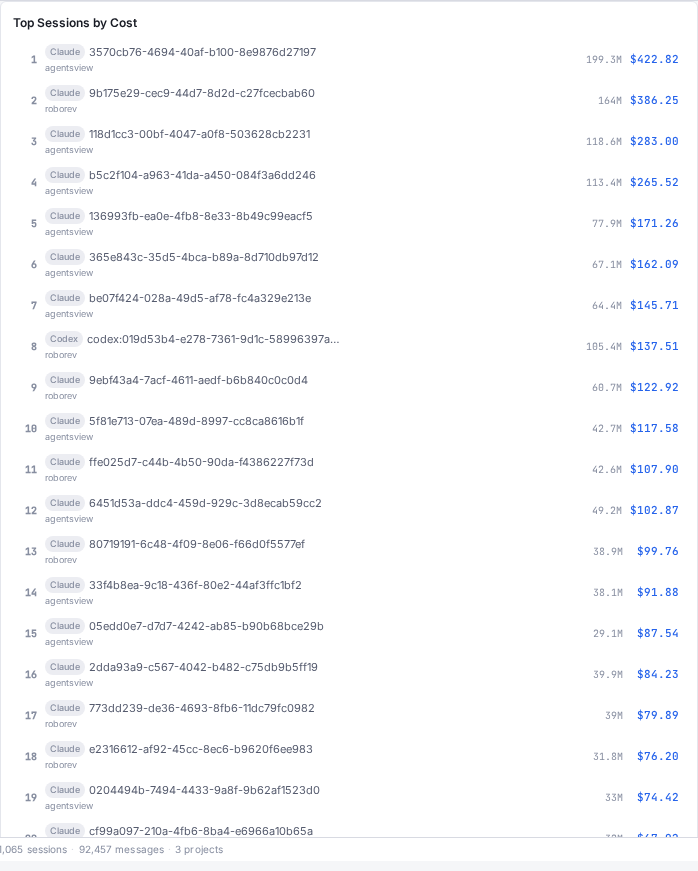
Top Sessions by Cost
A ranked list of the most expensive sessions in the window, with the agent pill, session name, project, token total, and cost. Click any row to jump straight to that session in the message viewer.
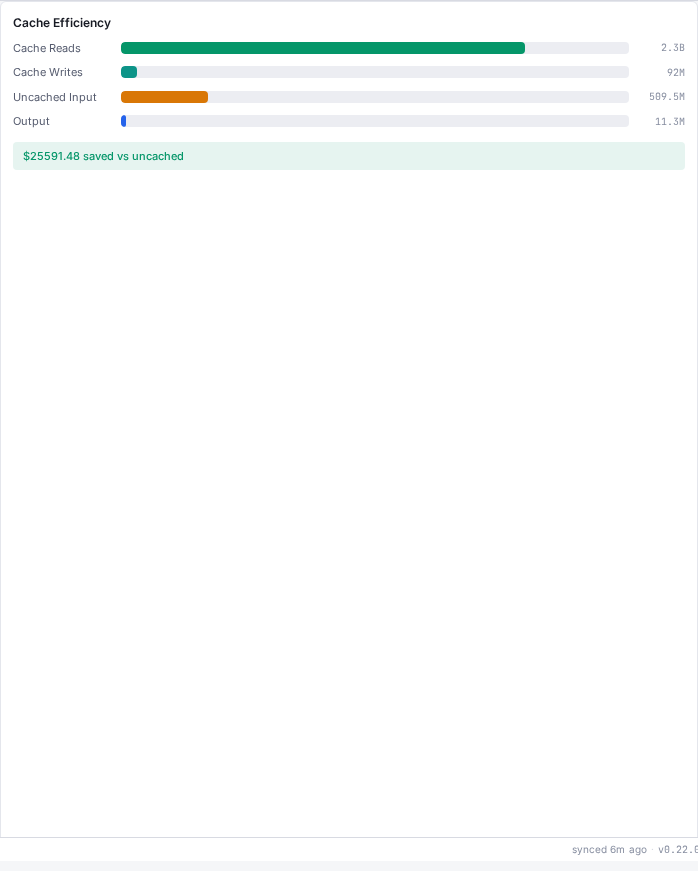
Cache Efficiency
A stacked bar breakdown of cache reads, cache writes, uncached input tokens, and output tokens, plus a savings callout showing how much you saved (or overspent) versus a no-cache baseline. Useful for spotting prompts that are blowing through cache creation without earning the reads back.
The dashboard reads from the same model_pricing table
that backs the CLI commands below, so the numbers line up
exactly with what agentsview usage daily prints.
PostgreSQL-Backed Usage
As of 0.23.0, the Usage page and usage API also work when the UI is
served from PostgreSQL via agentsview pg serve. That
means shared or multi-machine deployments can browse the same cost
and token dashboards without relying on a local SQLite archive.
The live SSE refresh path is still specific to the normal local
serve runtime. pg serve is read-only and does not expose the
global live event stream.
Quick Tour
# Last 30 days of spend as a terminal tableagentsview usage daily
# Full history, with per-model breakdown rowsagentsview usage daily --all --breakdown
# JSON output for scriptingagentsview usage daily --json > spend.json
Examples:
> agentsview usage daily --since 2026-04-01DATE        INPUT      OUTPUT    CACHE_CR   CACHE_RD    COST        MODELS----        -----      ------    --------   --------    ----        ------2026-04-01  77116868   2220604   39278251   887929665   $867.5794   claude-opus-4-6, gpt-5.4, claude-haiku-4-5-20251001, claude-sonnet-4-6, gemini-3.1-pro-preview2026-04-02  39512998   2052183   32282358   669276138   $639.0390   claude-opus-4-6, gpt-5.4, claude-sonnet-4-6, claude-haiku-4-5-202510012026-04-03  44691255   1546401   28098708   429185669   $505.4604   claude-opus-4-6, gpt-5.4, claude-sonnet-4-6, claude-haiku-4-5-202510012026-04-04  46934657   1325888   14553015   414338356   $395.3920   claude-opus-4-6, gpt-5.4, claude-sonnet-4-6, claude-haiku-4-5-20251001, gpt-5.4-mini, gemini-3.1-pro-preview2026-04-05  25170256   1941103   30847323   561656999   $528.7120   claude-opus-4-6, gpt-5.4, claude-sonnet-4-6, claude-haiku-4-5-20251001, gemini-3.1-pro-preview2026-04-06  31754752   2229449   35744879   819607019   $737.4766   claude-opus-4-6, gpt-5.4, claude-haiku-4-5-20251001, gemini-3.1-pro-preview2026-04-07  8892030    845077    13634936   320512173   $267.4140   claude-opus-4-6, gpt-5.4, claude-sonnet-4-6, claude-haiku-4-5-20251001, gemini-3.1-pro-preview2026-04-08  31293887   1544001   20655222   342488168   $382.1367   claude-opus-4-6, gpt-5.4, claude-haiku-4-5-20251001, claude-sonnet-4-6, gemini-3.1-pro-preview2026-04-09  13727647   993999    15882703   365800542   $319.4668   claude-opus-4-6, gpt-5.4, claude-haiku-4-5-202510012026-04-10  31267328   1733973   23694161   457175785   $460.5217   claude-opus-4-6, gpt-5.4, claude-haiku-4-5-20251001, claude-sonnet-4-62026-04-11  15380652   1346181   27087393   614828847   $522.8961   claude-opus-4-6, gpt-5.4, claude-haiku-4-5-202510012026-04-12  3633802    871157    7123679    231912052   $188.7764   claude-opus-4-6, gpt-5.4, claude-sonnet-4-6----        -----      ------    --------   --------    ----        ------TOTAL       369376132  18650016  288882628  6114711413  $5814.8710
# One-line today's spend (for prompt or tmux status line)> agentsview usage statusline$195.64 today
The daily table shows input, output, cache-creation, and
cache-read token totals per local-time day, the estimated cost,
and the models that contributed to each row. Adding
--breakdown prints indented per-model sub-rows so you can see
which model drove the spend on each day.
How Costs Are Computed
Every message parsed from a session file stores its raw
token_usage JSON (input, output, cache creation, cache read)
and the model name reported by the agent. The usage command:
- Loads the
model_pricingtable into memory once per invocation. The table holds per-million-token rates for input, output, cache creation, and cache read. - Scans
messagesfiltered by the requested date range and agent, parsing each row’stoken_usageblob in Go withgjson— faster than SQLite’s per-rowjson_extract. - Multiplies each row’s tokens by the model’s rates, buckets the result by local-time day, and aggregates per model.
The default window is the last 30 days; pass --all to scan
the full history.
Pricing Source
Model rates come from the
LiteLLM model pricing catalog,
which is fetched on each usage invocation and upserted into
the model_pricing table. If the fetch fails — no network, or
LiteLLM is down — AgentsView falls back to an embedded copy of
the catalog so offline use keeps working. Pass --offline to
skip the fetch entirely and always use the embedded fallback.
The embedded fallback is updated with AgentsView releases, so
the numbers are as current as your installed version. For
up-to-the-minute rates, leave --offline off.
Custom Model Pricing
As of 0.24.0, you can supply per-million-token rates for
models that aren’t in the LiteLLM catalog, or override the
catalog’s rates for models that are. Add
[custom_model_pricing.<model>] tables to
~/.agentsview/config.toml:
[custom_model_pricing."acme-ultra-2.1"]input = 2.0output = 8.0cache_creation = 2.5cache_read = 0.2
[custom_model_pricing.internal-tiny]input = 0.2output = 0.8| Field | Description |
|---|---|
input | USD per million input tokens (defaults to 0 if omitted) |
output | USD per million output tokens (defaults to 0 if omitted) |
cache_creation | USD per million cache-creation tokens (optional, defaults to 0) |
cache_read | USD per million cache-read tokens (optional, defaults to 0) |
The table key is the model name as it appears in your session
data (match the string the agent itself writes, dots and all —
quote the key if it contains special characters). Custom rates
take precedence over both the LiteLLM fetch and the embedded
fallback, and apply to the Usage dashboard, the agentsview usage CLI, and pg serve alike. A custom entry replaces the
full rate row for that model, so omitted fields are treated as
zero rather than falling through to LiteLLM. Models without a
custom entry continue to resolve through LiteLLM as before.
Claude Streaming & Codex Token Events
The 0.20.0 cost tracking release also improved how raw token usage is extracted so the input side of the equation is accurate:
- Claude Code: streaming deltas previously wrote the same token counts multiple times, roughly doubling input totals. The parser now deduplicates them.
- Codex: per-request
token_countevents embedded inevent_msgentries are now captured, so Codex sessions have populated token usage where they previously reported zero.
If you upgraded from an earlier version, the first usage
invocation triggers a full resync so these corrections apply
to historical sessions.
How It Compares to ccusage
ccusage re-walks every Claude Code JSONL file and re-parses
from scratch on every invocation. agentsview usage queries
pre-indexed SQLite with an in-memory pricing join, so the cost
of reporting drops dramatically as history grows.
Measured on a real 22,000-session database (~310,000 token-bearing messages) on an M5 Max, median of 5 steady-state runs:
| Command | Time | Speedup vs ccusage |
|---|---|---|
npx ccusage@latest daily --json --offline | 44.59 s | 1× |
agentsview usage daily --json --all --offline | 0.53 s | 84× |
agentsview usage daily --json --offline (default 30 d) | 0.41 s | 109× |
agentsview usage daily --json --offline --no-sync | 0.20 s | 223× |
Apples-to-apples: ccusage scans all history by default, so
the --all row is the matched comparison. The default 30-day
window is faster still because most invocations don’t need
four months of history, and --no-sync skips the
refresh-recent-files pass entirely (useful when you just want
to re-render an existing report).
Beyond raw speed, agentsview usage:
- Works beyond Claude Code — coverage has grown to
Claude Code, Codex, OpenCode, and Pi from the same database
and command, with OpenCode and Pi added in 0.22.0. More
agents will light up as their parsers start emitting
per-message token usage. Filter with
--agent <name>when you want a single-agent view. - Shares one database with the UI — the same data powers Analytics and session detail views, so there’s no second index to keep fresh.
- Includes on-demand sync — when no AgentsView server is
running,
usagedoes a quick incremental sync scoped to files modified since the last sync start time so reports always reflect current state. Skip with--no-syncfor the fastest path.
agentsview usage daily
Daily cost report. Outputs a tab-aligned table to stdout by
default, or JSON with --json.
agentsview usage daily [flags]| Flag | Default | Description |
|---|---|---|
--json | false | Emit a JSON document instead of a table |
--since | 30 days ago | Start date (YYYY-MM-DD), inclusive |
--until | End date (YYYY-MM-DD), inclusive | |
--all | false | Include all history; overrides the default 30-day window |
--agent | Filter by agent name (e.g. claude, codex) | |
--breakdown | false | Show indented per-model sub-rows under each day |
--offline | false | Skip the LiteLLM fetch; use the embedded fallback pricing |
--no-sync | false | Skip the on-demand sync pass before querying |
--timezone | system | IANA timezone name used for date bucketing |
The default 30-day window only kicks in when neither --since
nor --until nor --all is given. Passing just --until
leaves the start open so “everything up to X” still works.
JSON shape:
{ "daily": [ { "date": "2026-04-12", "inputTokens": 33410, "outputTokens": 142805, "cacheCreationTokens": 301223, "cacheReadTokens": 2984511, "totalCost": 9.6052, "modelsUsed": ["claude-opus-4-6", "gpt-5.1"], "modelBreakdowns": [ { "modelName": "claude-opus-4-6", "inputTokens": 28102, "outputTokens": 124901, "cacheCreationTokens": 287441, "cacheReadTokens": 2812004, "cost": 8.4123 } ] } ], "totals": { "inputTokens": 134450, "outputTokens": 528375, "cacheCreationTokens": 1172133, "cacheReadTokens": 10908442, "totalCost": 36.4700 }}modelsUsed is sorted by cost within each day, so the most
expensive model appears first. modelBreakdowns always
includes a row per model, regardless of whether --breakdown
was passed; the flag only controls terminal table output.
The JSON schema is considered stable for the fields shown above, but new fields may be added in future releases — treat it as additive and ignore unknown keys.
agentsview usage statusline
One-line today’s spend, designed for shell prompts, tmux status lines, and window titles.
agentsview usage statusline [flags]| Flag | Default | Description |
|---|---|---|
--agent | Filter by agent name | |
--offline | false | Use embedded fallback pricing only |
--no-sync | false | Skip on-demand sync |
Output is a single line:
$9.61 todayWith --agent claude:
$6.42 today (claude)The command always scopes to the current local-time day. Use
agentsview usage daily --since $(date +%Y-%m-%d) if you want
the full row instead.
Example: Starship Prompt Module
[custom.agentsview]command = "agentsview usage statusline --offline --no-sync"when = "true"format = "[$output]($style) "style = "bold green"Pair with --no-sync so the prompt never blocks on a sync
pass; a separate agentsview server (or a periodic
agentsview sync cron) keeps the database fresh.
On-Demand Sync
When no AgentsView server is running, the usage commands do
a quick incremental sync before querying so reports always
include recent activity:
- If the parser data version has changed (i.e. you just upgraded), a full resync runs first.
- Otherwise, the sync scans only files modified since the last recorded sync start time, minus a 10-second safety margin to catch files written during the prior sync.
If an agentsview serve process is already running, the file
watcher already has you covered and the on-demand sync is skipped
to avoid duplicate work. A running pg serve process does not keep
your local SQLite archive fresh, so the CLI still treats the local
archive as the source of truth for command-line reporting.
Pass --no-sync to skip the refresh unconditionally — useful
for scripting and for prompt modules that must stay snappy.
Scripting Examples
Monthly spend for the current month:
agentsview usage daily \ --since "$(date +%Y-%m-01)" \ --json \ | jq '.totals.totalCost'Per-agent totals for the last 7 days:
date arithmetic differs between BSD (macOS) and GNU (Linux),
so the snippet tries the BSD form first and falls back to GNU:
since=$(date -v-7d +%Y-%m-%d 2>/dev/null \  || date -d '7 days ago' +%Y-%m-%d)
for a in claude codex copilot gemini; do  total=$(agentsview usage daily \    --since "$since" \    --agent "$a" \    --json 2>/dev/null \    | jq '.totals.totalCost')  printf "%-8s  \$%s\n" "$a" "$total"done
Alert when today crosses a budget:
The script writes to stderr and exits non-zero so you can wire
it into whatever notifier fits your OS — cron’s MAILTO,
launchd’s StandardErrorPath, a systemd timer’s journal, or a
Windows Task Scheduler action:
today=$(agentsview usage statusline --offline --no-sync \ | tr -dc '0-9.')if awk -v t="$today" 'BEGIN {exit !(t+0 > 25)}'; then echo "AgentsView: AI spend \$$today today (> \$25)" >&2 exit 1fiWhere the Data Lives
Usage reports read from the same local SQLite database that
powers the web UI and
Analytics dashboard. Token usage is
stored on each message row in the messages table; pricing is
cached in a small model_pricing table that’s refreshed on
each usage invocation.
No data leaves your machine. The only outbound request is the
LiteLLM pricing fetch, which you can disable with --offline.
See Privacy and Telemetry
for the full picture.